
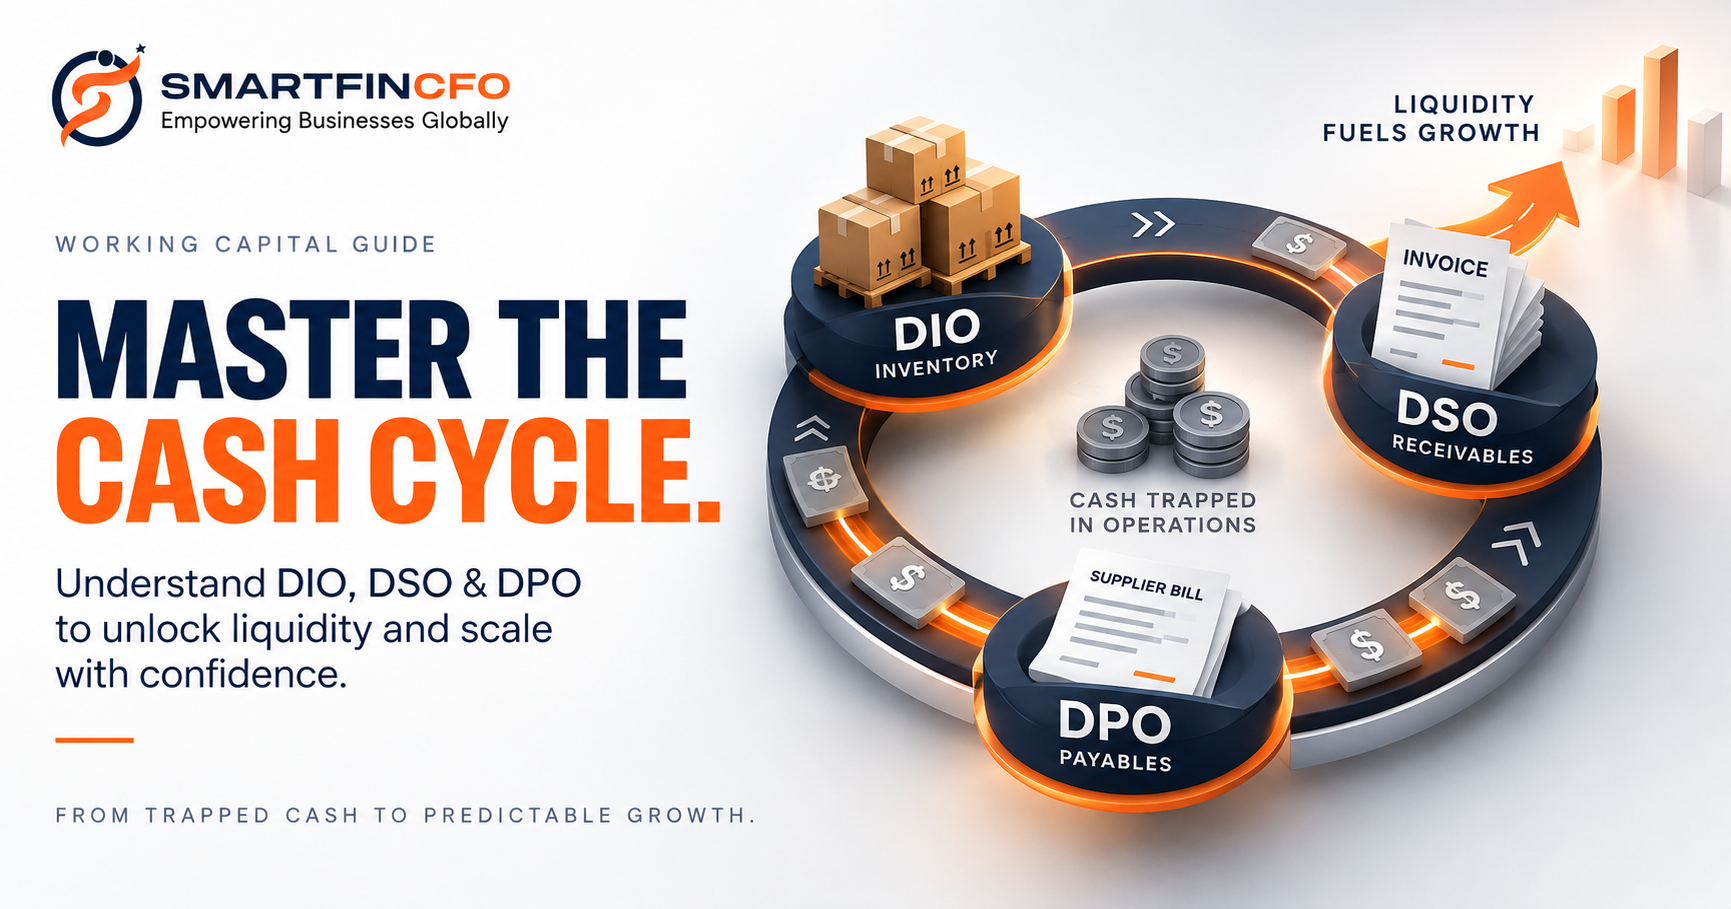
A fast-growing business can easily run out of money while showing record profits on paper. This paradox—often called the growth trap—catches founders off guard because standard accounting metrics like revenue, EBITDA, and gross margin do not reflect the physical velocity of money flowing in and out of a bank account.
Every dollar invested into inventory, raw materials, supplier deposits, or outstanding customer invoices represents capital trapped inside daily operations. The operational metric that measures the speed at which capital moves from cash spent to cash collected is the Cash Conversion Cycle (CCC).
Understanding and optimizing your cash conversion cycle is fundamental to effective working capital management. When you compress this cycle, you free up trapped liquidity, eliminate the need for expensive short-term bridge loans, build a predictable engine for cash flow management and forecasting, and significantly improve investor appeal when preparing for business valuation services.

What Is the Cash Conversion Cycle (CCC)?
The Cash Conversion Cycle (also referred to as the net operating cycle) measures the elapsed time (in days) between purchasing inventory or operational inputs and collecting the resulting cash from customer sales.
In plain English: How many days is your cash trapped in operational limbo before it returns to your bank account with a profit attached?
The cycle is composed of three interconnected working capital metrics:
- Days Inventory Outstanding (DIO): How long inventory or work-in-progress sits before being sold.
- Days Sales Outstanding (DSO): How long it takes customers to settle invoices after a sale.
- Days Payable Outstanding (DPO): How long you take to pay suppliers and trade vendors.
The Mathematical Formula
Cash Conversion Cycle (CCC) = DIO + DSO − DPO
Where:
- DIO (Days Inventory Outstanding) = (Average Inventory ÷ Cost of Goods Sold) × 365
- DSO (Days Sales Outstanding) = (Average Accounts Receivable ÷ Total Credit Sales) × 365
- DPO (Days Payable Outstanding) = (Average Accounts Payable ÷ Cost of Goods Sold or Total Purchases) × 365
+-------------------------------------------------------------------------+
|                        THE CASH CONVERSION TIMELINE                     |
+-------------------------------------------------------------------------+

   Day 0                   Day 30                     Day 60          Day 90
   [Receive Inventory]     [Pay Supplier]             [Sell Goods]    [Collect Cash]
     |                       |                          |               |
     +-----------------------+                          |               |
     |    DPO = 30 Days      |                          |               |
     |  (Supplier Financing) |                          |               |
     +--------------------------------------------------+               |
     |                  DIO = 60 Days                   |               |
     |              (Inventory Holding Period)          |               |
                             +------------------------------------------+
                             |        CASH CONVERSION CYCLE = 60 DAYS   |
                             |  (Gap requiring working capital buffer)  |
                                                        +---------------+
                                                        | DSO = 30 Days |
                                                        | (Receivables) |
If your DIO is 60 days, your DSO is 30 days, and your DPO is 30 days, your Cash Conversion Cycle is:
CCC = 60 + 30 − 30 = 60 days
This means that for two full months, your business is funding operational float out of pocket before seeing a return.
Breaking Down the 3 Levers of Working Capital
Mastering the management of working capital requires founders to analyze and optimize each of the three components independently while recognizing how they influence total liquidity.
1. Days Inventory Outstanding (DIO): Eliminating Stock Drag
For physical product brands, direct-to-consumer (D2C) companies, wholesalers, and manufacturers, inventory is usually the single largest balance sheet trap. For services and SaaS firms, this metric translates into work-in-progress (WIP) or unbilled client milestones.
A high DIO indicates:
- Over-purchasing driven by inaccurate demand estimation.
- Slow-moving, dead, or obsolete stock gathering dust in fulfillment centres.
- Poor production cadence and procurement bottlenecks.
Every day an SKU sits in a warehouse, it incurs carrying costs (storage, insurance, damage risks) and locks up cash that could be allocated to performance marketing, talent acquisition, or product R&D.
2. Days Sales Outstanding (DSO): Accelerating Cash Collection
DSO evaluates your credit control efficiency. If you invoice $500,000 monthly on net-30 terms, but your average DSO is 55 days, your customers are using your balance sheet as an interest-free credit line.
Common drivers of elevated DSO include:
- Ambiguous payment terms and missing contractual milestones.
- Disorganized, manual invoicing cycles and delayed dispatch of invoices.
- Absence of automated follow-ups or systematic collection escalation matrices.
- Billing dispute backlogs caused by incorrect delivery or scope discrepancies.
When scaling rapidly, high DSO creates a severe cash gap. A business doubling revenue with a 60-day DSO must fund two full months of operational expenses ahead of incoming revenue.
3. Days Payable Outstanding (DPO): Maximizing Supplier Leverage
DPO measures the average time your business takes to pay vendor bills and raw material expenses. Unlike DIO and DSO, a higher DPO shortens your cash conversion cycle because it represents cash that stays in your account longer.
However, expanding DPO requires a balanced approach:
- Smart DPO Optimization: Securing extended terms (e.g., negotiating net-60 instead of net-30) through strong vendor relationships, early order volume commitments, or dynamic discounting.
- Destructive DPO Expansion: Arbitrarily delaying payments past agreed due dates, which destroys vendor trust, risks supply cutoffs, and damages credit ratings.
Cash Conversion Cycle Across Business Models
What represents an optimal Cash Conversion Cycle? The answer depends heavily on your operating model and industry dynamics.
| Business Model | Typical DIO | Typical DSO | Typical DPO | Typical CCC | Working Capital Dynamic | Strategy Priority |
|---|---|---|---|---|---|---|
| E-Commerce / D2C | 45–90 Days | 2–5 Days | 30–45 Days | +15 to +50 Days | Heavy upfront cash for inventory production. | Demand forecasting & lean inventory runs. |
| B2B SaaS / Software | 0 Days | 30–60 Days | 30 Days | 0 to +30 Days | High receivables if annual upfront deals are not mandated. | Push annual upfront billing & automated card debits. |
| B2B Services / Agencies | 15–30 Days (WIP) | 45–75 Days | 15–30 Days | +45 to +75 Days | Delayed invoice approvals and scope creep drain cash. | Deposit retainers & strict billing milestone triggers. |
| Manufacturing | 60–120 Days | 45–60 Days | 30–45 Days | +75 to +135 Days | Extreme working capital drag across raw material & WIP. | Just-in-time procurement & supplier financing. |
| Marketplaces / Retail Giants | 30 Days | 2 Days | 60–90 Days | -30 to -60 Days | Negative CCC: Collects cash before paying vendors. | Working capital is a source of free operating cash. |
The Superpower of a Negative Cash Conversion Cycle
When a company achieves a negative Cash Conversion Cycle, its customers pay before the company has to pay its suppliers. Companies like Amazon, Apple, and Dell built massive market capitalizations in part by operating with negative CCCs.
In a negative CCC environment, growth generates liquidity rather than consuming it. When you scale sales, your cash balance expands instantly, generating self-funded growth without relying on equity dilution or debt financing.
The Strategic Intersection: CCC, Cash Flow Forecasting, and Business Valuation
Many founders treat working capital metrics as backward-looking accounting details. In reality, your CCC directly governs your forward-looking financial runway and your ultimate corporate valuation.

Enhancing Cash Flow Management and Forecasting
Accurate forecasting of cash flow is nearly impossible without dynamic visibility into your cash conversion cycle. A standard static P&L budget will tell you your projected sales, but it will not tell you when that cash will actually clear your bank account.
By integrating dynamic DSO, DIO, and DPO metrics into rolling cash models—such as a 13-week rolling cash forecast—finance leaders can:
- Identify liquidity pinches weeks before they materialize.
- Model how seasonal inventory ramp-ups impact cash runway.
- Stress-test supplier payment terms against expected receivable lags.
Deploying dedicated software for cash flow forecasting and modern accounting automation software allows leadership to model scenarios in real time: "If DSO increases by 8 days during Q3, what does our required operating cushion look like?"
How Working Capital Efficiency Influences Business Valuation Services
When engaging institutional investors, M&A advisors, or professional business valuation services, working capital efficiency is one of the clearest indicators of operational quality.
Valuation models (particularly Discounted Cash Flow or DCF analyses) calculate enterprise value based on Free Cash Flow to Firm (FCFF):
FCFF = NOPAT + D&A − CapEx − ΔWorking Capital
Notice the deduction for changes in working capital (ΔWorking Capital). When your cash conversion cycle expands, your business requires more capital investment to generate the same revenue, directly depressing free cash flow and driving down enterprise valuation.
Conversely, a business with a short or negative CCC consistently commands premium valuation multiples because every incremental unit of revenue converts directly into realized, distributable cash.
Actionable Tactics to Optimize DSO, DIO, and DPO
Transforming working capital performance requires operational adjustments across sales, procurement, and billing operations.
+-----------------------------------------------------------------------------------------+
|                         WORKING CAPITAL OPTIMIZATION PLAYBOOK                           |
+-----------------------------------------------------------------------------------------+
|  DSO (Receivables)           |  DIO (Inventory & WIP)         |  DPO (Payables)                 |
+------------------------------+--------------------------------+---------------------------------+
| • Automate billing triggers  | • Adopt ABC inventory analysis | • Establish multi-tier approvals|
| • Upfront deposits & retainer| • Liquidate dead/slow stock    | • Negotiate early-pay discounts |
| • Multi-channel reminders    | • Shift to JIT procurement     | • Standardize payment cycles    |
| • Strict credit-limit terms  | • Tie WIP to billing gates     | • Utilize vendor terms leverage |
+-----------------------------------------------------------------------------------------+
Practical Strategies to Reduce DSO
- Automate Invoicing Workflows: Replace manual spreadsheet billing with modern accounting automation software that dispatches invoices instantly upon contract execution or product delivery.
- Incentivize Early Settlement: Offer dynamic payment terms such as
2/10 Net 30(a 2% discount if settled within 10 days). - Deploy Multi-Channel Receivables Tracking: Establish automated notification schedules across email and messaging channels (e.g., WhatsApp for business) 7 days before due date, on due date, and at 3, 7, and 14 days overdue.
- Restructure Payment Terms: Require upfront deposits (30–50%) for enterprise engagements or mandate automated recurring credit card/ACH billing for monthly contracts.
Practical Strategies to Reduce DIO
- Implement ABC Stock Categorization:
- Category A: High-value, fast-turning items (manage tightly with frequent, small orders).
- Category B: Moderate-value, steady items.
- Category C: Low-value, slow-moving items (avoid over-ordering to prevent trapped cash).
- Establish Real-Time Inventory Visibility: Integrate your inventory management stack directly with your cash flow forecasting software to tie stock orders to actual consumption patterns.
- Discount or Liquidate Stale Stock: Freeing up cash at break-even or a slight loss is often better than holding non-moving stock that incurs storage fees and ties up working capital.
Practical Strategies to Optimize DPO
- Standardize Centralized Payment Runs: Move away from ad-hoc manual payouts. Run vendor disbursements on set days (e.g., bi-weekly on the 1st and 15th) via automated approval workflows.
- Renegotiate Terms with Strategic Vendors: Leverage proven payment reliability to request 45-day or 60-day terms from your top 20% of vendors by volume.
- Avoid Unearned Early Payments: Do not settle net-30 invoices on day 5 unless a compelling prompt-payment discount is offered that exceeds your cost of capital.
Building a Scalable Working Capital Management Engine
To move from reactive fire-fighting to proactive strategic leadership, founders must operationalize CCC governance into a dependable weekly rhythm:
- Implement Real-Time Financial Visibility: Unify your general ledger, bank accounts, CRM, and billing systems via accounting automation software to ensure your balance sheet data is audit-ready and up to date.
- Monitor CCC Metrics Weekly: Track DSO, DIO, DPO, and CCC on an executive dashboard rather than reviewing them once a quarter.
- Link CCC Directly to Rolling Cash Forecasts: Feed receivables ageing schedules and accounts payable commitments into a 13-week rolling cash forecast to maintain dynamic runway visibility.
- Align Cross-Departmental Incentives: Ensure your sales team isn't closing deals on 90-day credit terms without finance approval, and make sure procurement aligns order quantities with actual sales velocity.
By treating the Cash Conversion Cycle as a core operational discipline, you insulate your company against liquidity shocks, preserve precious equity, and build a resilient, high-valuation business primed for sustainable scale.