
For high-growth founders and business promoters, there is a distinct difference between having accounting data and having financial control. Most growing companies generate dozens of transactional reports every month—trial balances, general ledgers, and bank statements from platforms like Tally, Zoho Books, or QuickBooks Online. Yet, when asked about runway under stressed operational conditions, true unit-level gross margins, or customer collection delays, many founders find themselves waiting weeks for an answer.
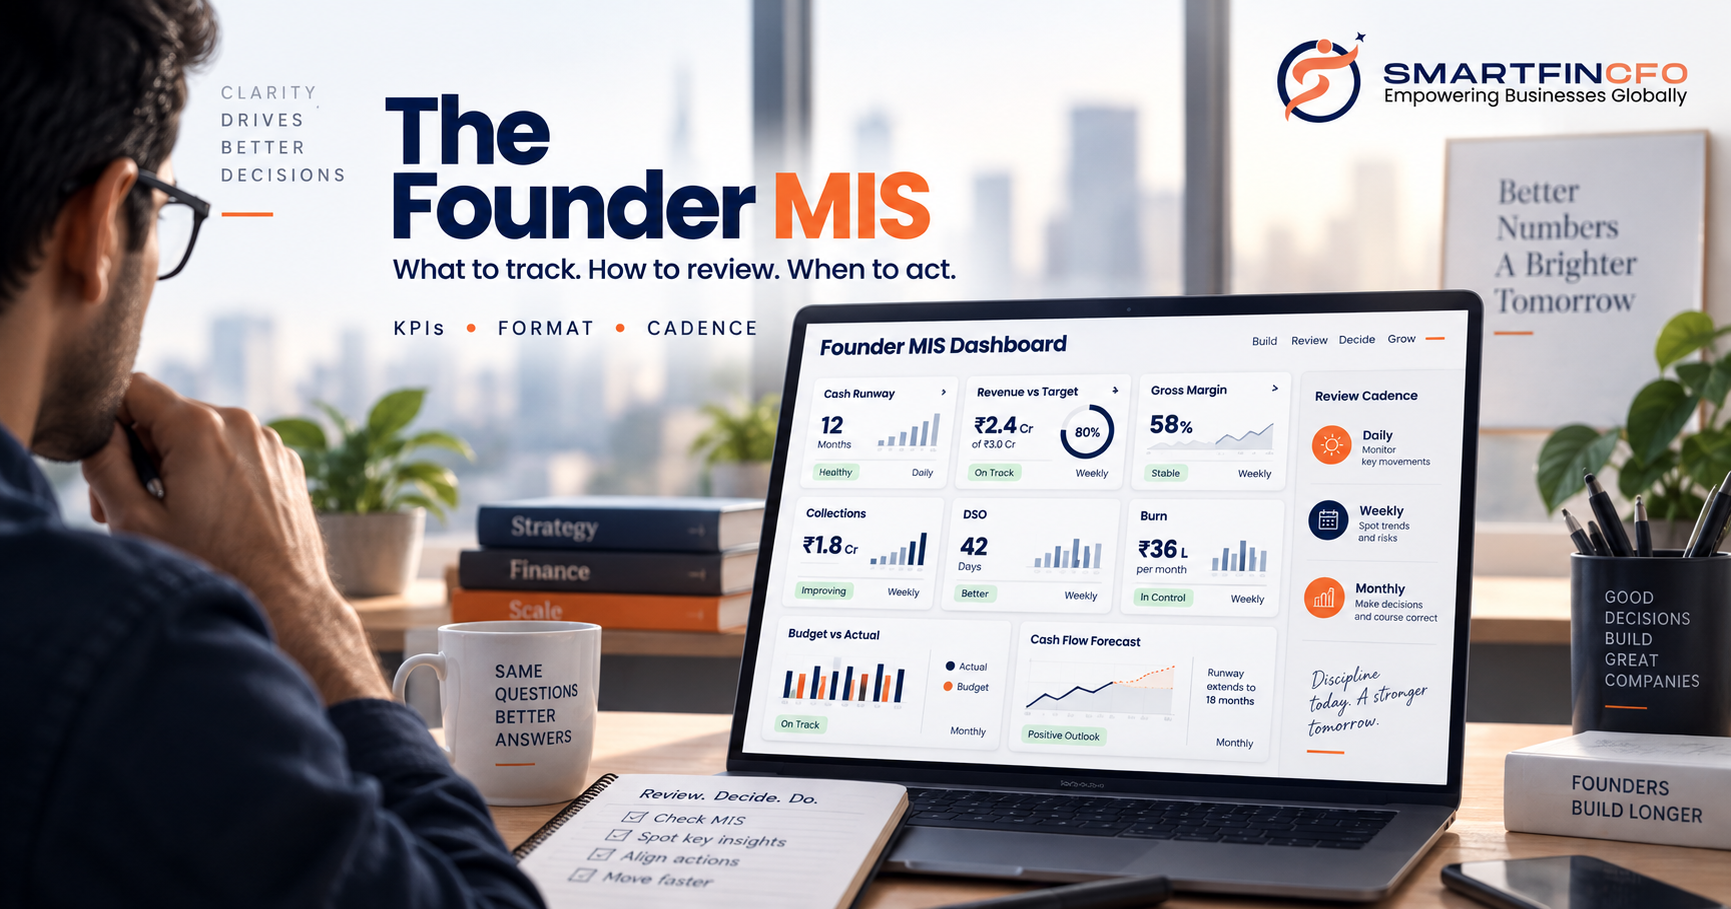
A Management Information System (MIS) dashboard bridges the gap between raw compliance bookkeeping and executive decision-making. Rather than serving as an exhaustive financial dump, a founder-level MIS functions as an executive cockpit: highlighting liquidity trends, operational bottlenecks, unit economics, and growth trajectories.
Designing an effective MIS requires structuring the right Key Performance Indicators (KPIs), establishing structured reporting formats, and implementing a repeatable review cadence powered by modern financial systems.
The Core Architecture of an Executive MIS Dashboard
A common mistake when building management reports is attempting to fit every accounting ledger onto a single spreadsheet. A well-designed founder MIS follows a layered architecture, moving from macro enterprise health down to operational drivers:
- Executive Command View (The Macro Layer): High-level health scorecards, including net cash balance, monthly burn rate, runway in months, total revenue, gross margin percentage, and operating EBITDA.
- Liquidity & Working Capital Control: Accounts Receivable (AR) ageing, Days Sales Outstanding (DSO), Accounts Payable (AP) schedules, Days Payable Outstanding (DPO), and cash conversion cycles.
- Profitability & Variance Analysis: Departmental budgets versus actual spend, contribution margins by product or business unit, and unit-economic trends.
- Forward-Looking Projections: Short-term rolling liquidity forecasts and multi-year operating model assumptions.
By organizing financial data hierarchically, leadership teams can immediately spot operational anomalies without getting lost in ledger-level details.

Essential KPIs Every Founder MIS Must Track
To drive strategic decisions, your MIS should group metrics into four functional pillars: Liquidity, Efficiency, Profitability, and Growth.
+-----------------------------------------------------------------------------------------+
|                              FOUNDER MIS KPI MATRIX                                     |
+----------------------------+-----------------------------+------------------------------+
| Liquidity & Cash           | Working Capital & Efficiency| Profitability & Margins      |
+----------------------------+-----------------------------+------------------------------+
| • Net Cash Balance         | • Days Sales Outstanding    | • Gross Margin %             |
| • 13-Week Cash Buffer      | • Debtor Ageing (>60/90 d)  | • Contribution Margin (CM2)  |
| • Net Monthly Burn Rate    | • Days Payable Outstanding  | • Operating EBITDA           |
| • Stressed Runway (Months) | • Cash Conversion Cycle     | • Budget vs. Actual Variance |
+----------------------------+-----------------------------+------------------------------+
1. Liquidity and Runway Metrics
- Available Liquidity: Unencumbered cash, liquid mutual funds, and accessible credit facilities.
- Net Burn Rate: Total monthly operational cash outflows minus operational cash inflows.
- True Runway: Available cash divided by the 3-month trailing average net burn rate, stress-tested against delayed receivables.
2. Working Capital & Cash Conversion KPIs
- Days Sales Outstanding (DSO): Measures how long it takes to collect cash from customers after a sale is completed.
- Receivables Ageing Distribution: Breakdown of outstanding invoices into 0–30, 31–60, 61–90, and 90+ day buckets.
- Cash Conversion Cycle (CCC): The total time required to turn inventory and operational investments back into cash.
3. Margin & Cost Control KPIs
- Gross Margin & Contribution Margin: Tracking direct labor, cost of goods sold (COGS), and variable overhead to ensure top-line expansion generates genuine gross profit.
- Departmental Variance Analysis: Monitoring deviations between approved budget thresholds and actual spend to curb uncontrolled overhead.
Cash Flow Forecasting: From Spreadsheets to Dynamic Models
Static accounting reports tell you where money went in the past; cash flow forecasting tells you where your business will stand in 90 days. For early-stage businesses, managing liquidity often begins with a cash flow forecasting excel template.
A structured spreadsheet model allows teams to map expected customer collections, payroll cycles, statutory tax obligations (GST, TDS, PF), vendor payouts, and capital expenditure across weekly intervals.
Concrete Example of Cash Flow Forecasting (13-Week Horizon)
Consider an operational cash flow forecasting example for a high-growth B2B services business with ₹1.5 crore in opening cash reserves:
+------------------------------------+------------+------------+------------+------------+
| Cash Flow Item (in ₹ Lakhs)        |   Week 1   |   Week 2   |   Week 3   |   Week 4   |
+------------------------------------+------------+------------+------------+------------+
| Opening Cash Balance               |   150.00   |   143.50   |   128.50   |   151.50   |
+------------------------------------+------------+------------+------------+------------+
| Inflows:                           |            |            |            |            |
| - Expected Customer Collections    |    12.00   |     8.00   |    45.00   |    18.00   |
| - Other Operating Receipts         |     1.50   |     2.00   |     0.00   |     1.00   |
| Total Inflows                      |    13.50   |    10.00   |    45.00   |    19.00   |
+------------------------------------+------------+------------+------------+------------+
| Outflows:                          |            |            |            |            |
| - Payroll & Contractor Payouts     |     0.00   |    18.00   |     0.00   |     0.00   |
| - Vendor & Infrastructure Payables |    14.00   |     5.00   |    12.00   |     8.00   |
| - Statutory Dues (GST, TDS, PF)    |     6.00   |     2.00   |    10.00   |     3.00   |
| Total Outflows                     |    20.00   |    25.00   |    22.00   |    11.00   |
+------------------------------------+------------+------------+------------+------------+
| Net Cash Movement                  |    -6.50   |   -15.00   |   +23.00   |    +8.00   |
+------------------------------------+------------+------------+------------+------------+
| Closing Cash Balance               |   143.50   |   128.50   |   151.50   |   159.50   |
+------------------------------------+------------+------------+------------+------------+
While starting with a cash flow forecasting template excel workbook is an effective baseline, manual spreadsheets become fragile as transactional volume scales. Formula errors, disconnected ERP ledgers, and manual data-entry delays can obscure imminent cash crunches.
Modern finance transformation replaces static spreadsheets with rolling 13-week forecast engines integrated directly with core accounting ledgers and bank feeds.
The Role of Automation in Accounting and Finance Transformation
Building an executive MIS cannot depend on days of manual number-crunching at month-end. When teams spend 80% of their time reconciling bank accounts and transcribing invoice data, reporting is delivered late, rendering it obsolete for strategic agility.

The Impact of Automation in Accounting
Implementing automation in accounting creates a unified pipeline between transaction processing and executive dashboards:
- Automated Ingestion & Reconciliation: Directly connecting bank payout systems and payment gateways with platforms like Zoho Books or QuickBooks removes reconciliation bottlenecks.
- AI-Assisted Anomaly Detection: Intelligent audit scripts detect duplicate ledger entries, mismatched tax rates, and uncharacteristic vendor charges before books close.
- Receivables Ageing Alerts: Automated dunning workflows identify overdue debtor milestones and alert account managers to take proactive escalation measures.
Digital Transformation Across the Finance Industry
The ongoing digital transformation in finance industry practices is fundamentally altering how organizations handle reporting, compliance, and capital management. Historically, corporate finance operated in isolated silos—bookkeepers entered data, controllers compiled backward-looking ledgers, and executives made decisions on intuition.
Today, digital transformation in finance unites cloud accounting infrastructure, automated banking integrations, and real-time analytics. As companies embrace this shift, combining accounting and automation elevates the entire finance function. Rather than eliminating human expertise, digital finance transformation shifts the talent profile: modern finance transformation jobs demand strategic advisors who interpret automated telemetry, model capital allocation scenarios, stress-test working capital, and guide promoter-level strategy.
Structuring the Reporting Cadence: Operational vs. Strategic Rhythms
An MIS dashboard is only as valuable as the decision cadence built around it. Overloading founders with daily ledger reports creates decision fatigue, while reviewing financials solely at quarterly intervals leaves leadership blind to rapid cash burn.
A disciplined finance operating rhythm divides reporting into distinct operational cadences:
1. The Daily / Weekly Liquidity Flash
- Audience: Founder, Finance Head, Operations Lead.
- Format: Single-screen summary (Notion, Google Sheets, or automated Slack/WhatsApp summary).
- Contents: Real-time bank balances, daily customer collections, urgent vendor releases, and projected net cash movement for the upcoming 7 days.
2. The Monthly MIS & Budget Variance Pack
- Audience: Executive leadership, Business Unit Heads, Board Observers.
- Format: Standardized slide deck or interactive multi-tab dashboard.
- Contents: Detailed Profit & Loss statement, Balance Sheet, Cash Flow statement, DSO/DPO ageing schedules, customer acquisition economics, and budget vs. actual variance analysis with root-cause explanations.
3. The Quarterly Strategic Review
- Audience: Promoters, Board of Directors, Key Investors.
- Format: Strategic governance memo and five-year dynamic scenario forecast.
- Contents: Unit economics trends, pricing strategy evaluation, capital allocation assessments, scenario models for expansion or hiring, and valuation preparedness.
Practical Implementation: From Chaos to a Founder Cockpit
Transitioning from messy, delayed books to a dependable founder dashboard requires a structured roadmap:
+-----------------------------------------------------------------------------------------+
|                         FINANCE SYSTEM TRANSFORMATION ROADMAP                           |
+-----------------------------------------------------------------------------------------+
| Phase 1: Financial Hygiene (Days 1–30)                                                  |
| -> Clean historic ledgers, establish closing checklists, automate bank reconciliations |
+-----------------------------------------------------------------------------------------+
| Phase 2: Operational Controls (Days 31–60)                                              |
| -> Deploy 13-week cash forecasting, AR follow-up SOPs, and departmental budget limits  |
+-----------------------------------------------------------------------------------------+
| Phase 3: Executive Intelligence (Days 61–90)                                            |
| -> Launch automated promoter dashboard, KPI scorecards, and scenario models            |
+-----------------------------------------------------------------------------------------+
Step 1: Establish Financial Hygiene and Bank Reconciliations
Before designing visual graphs, verify transaction accuracy. Implement rigorous monthly closing checklists, clear suspense accounts, and ensure reconciliations across all bank and tax accounts occur on a weekly cycle.
Step 2: Formalize Role-Based Accountability
Assign explicit ownership over every metric. If DSO increases, the sales and collections teams must have predefined escalation protocols. When departmental costs exceed approved budgets, automated variance alerts should trigger manager reviews before further expenses are incurred.
Step 3: Layer Strategic Finance Leadership over Automation
Automation tools process data efficiently, but strategic finance leaders contextualize the outputs. Pair automation engines with experienced virtual CFO guidance to interpret working-capital shifts, evaluate growth scenarios, and maintain audit-ready financial books.
Final Thoughts: Turning Financial Data into Business Command
A founder MIS dashboard is far more than an operational report—it is the strategic operating system of your business. When backed by reliable books, intelligent accounting automation, and a disciplined review rhythm, an MIS transforms reactive management into proactive business command.
By replacing manual guesswork with real-time liquidity visibility, clear unit economics, and rolling cash flow projections, founders can confidently allocate resources, protect runway, and scale sustainably.